Historical Sea Ice Atlas
Location of the Data
Spatial data can be visualized and accessed on the AOOS website Ocean Data Explorer (data portal), as well as the Atlas project website, hosted by the University of Alaska, Fairbanks (UAF). The data available on both the UAF and AOOS websites lag by one year to allow for processing.
The Need
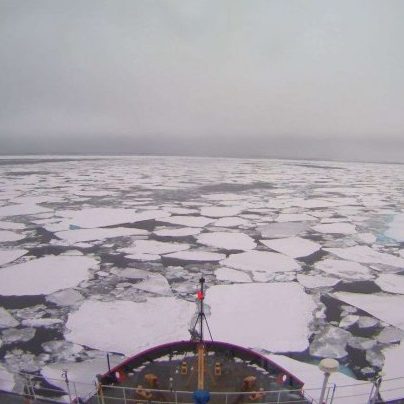
Thickness and extent of summer sea ice in the Arctic, including around Alaska, have shown a dramatic decline over the past 30 years, as seen in the satellite record starting in 1979. The loss of sea ice has the potential to increase global warming trends and influence climate patterns worldwide. Scientists and resource managers in Alaska are concerned with changing ice dynamics and the resulting impacts on the entire ecosystem, both marine and terrestrial. On one hand, the shrinking sea ice cover in the Arctic has the potential to bolster socioeconomic activity, including oil exploration as more areas once covered by ice year-round become exposed and for longer periods of time. Vessel traffic is also expected to increase dramatically due to existing northern shipping lanes around the world being ice-free for longer periods of time. Changes in sea ice condition and increased shipping will in turn directly affect remote coastal communities and their activities, including coastal travel conditions and subsistence hunting. Compounding ongoing coastal erosion in the Arctic are the increased number of ice-free, open water days, which leave the coastline—already experiencing erosion from thawing permafrost—exposed to waves for longer periods of time during fall and spring storm seasons. This project provides a tool to visualize the long time series necessary to identify time scales of variability and ongoing trends in Arctic ice conditions.
Project Location
The Historical Sea Ice Atlas tool aggregates a wide variety of sea ice observations and measurements, from whaling ship logbooks from 1850 to near real-time passive microwave satellite data in the present, to generate a sea ice time series over 150 years long for the seas surrounding the state of Alaska, USA. This resource can be used to explore the trends in sea ice extent and concentration at multiple scales through time. The geographic extent of the data maintained in the Atlas is 500 km from shore, and the area includes the Bering Sea north of the Aleutian chain, into the Chukchi and Beaufort Seas. It also includes a select number of nearshore bays and inlets that have historical ice records – most notably Norton Sound and Cook Inlet.
Project Details
A variety of data on sea ice concentration and extent have been documented over the past 150 years at different resolutions and time intervals. However, the diverse nature and format of the data made it difficult to access and use. The data synthesis conducted during this project required the digitization of several historical datasets and the interpolation of these (and other previously digitized) datasets onto a common grid. The resulting Historical Sea Ice Atlas consists of digitally stored sea ice concentration data on a common grid covering all Alaska coastal waters to a distance of about 500 km (300 mi) from shore, with a spatial resolution of 1/4 degrees latitude and longitude. This equates to about 28km by 28 km. The time series starts in 1850 and spans to present day and has a temporal resolution of one month from 1850-1952 and one week from 1953-present.
Sources of data synthesized into the Atlas include:
- Arctic and Antarctic Research Institute (AARI) located in St. Petersburg, Russia
- Arctic Climate System Study (ACSYS)
- Danish Meteorological Institute (DMI)
- Japan Meteorological Agency
- Kelly ice extent grids digitized ice edge information from monthly maps of Danish Meteorological Institute
- Naval Oceanographic Office (NAVOCEANO)
- National Ice Center
- Navy-NOAA Joint Ice Center Climatology
- NSIDC Bill Dehn Data Collection
- NSIDC SMMR/SSMI/AMSR microwave sensor data
- Walsh and Johnson/Navy-NOAA Joint Ice Center: Early version of pan-Arctic digital database of Arctic sea ice concentrations
- Whaling ship logbooks documenting the position of the ice edge dating back to the 1850s
- Ice concentrations using the whaling ship logs are derived by imposing a concentration gradient based on the consistency of the ice edge reported by the various ships over a calendar month. For these historical records, the ice edge is a more reliable metric than ice concentration.
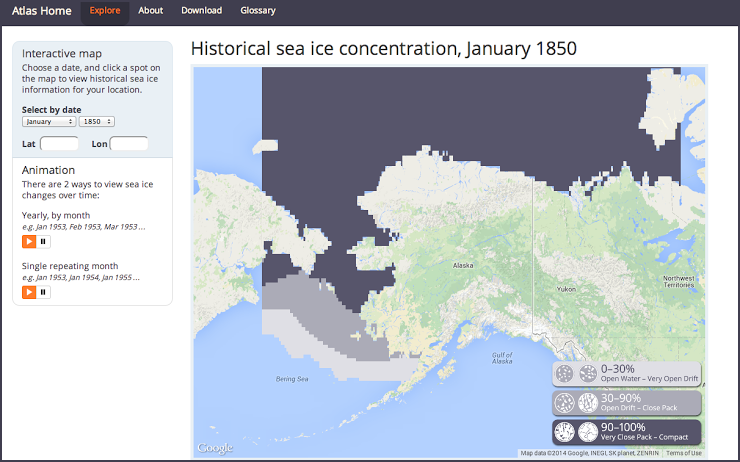
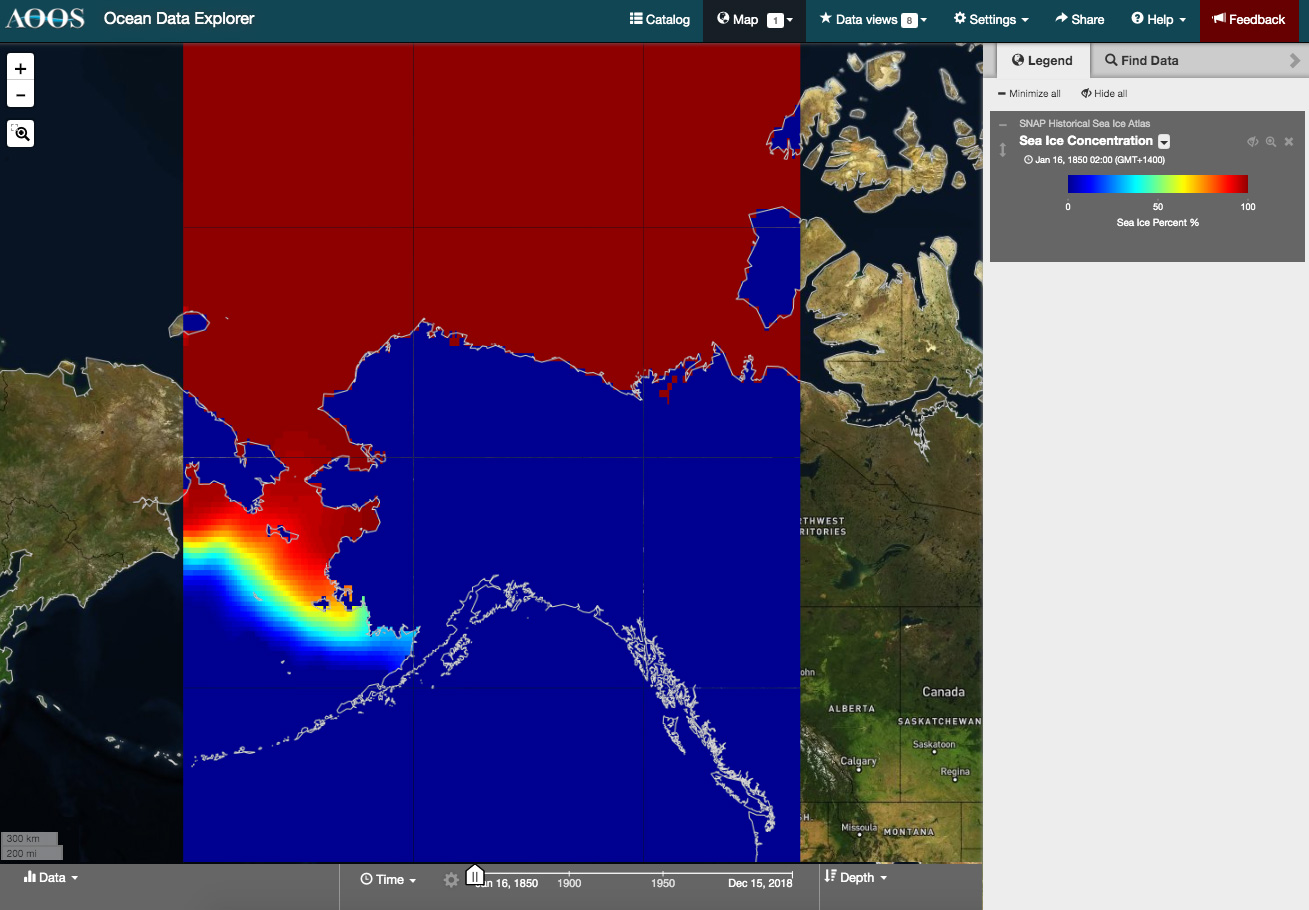
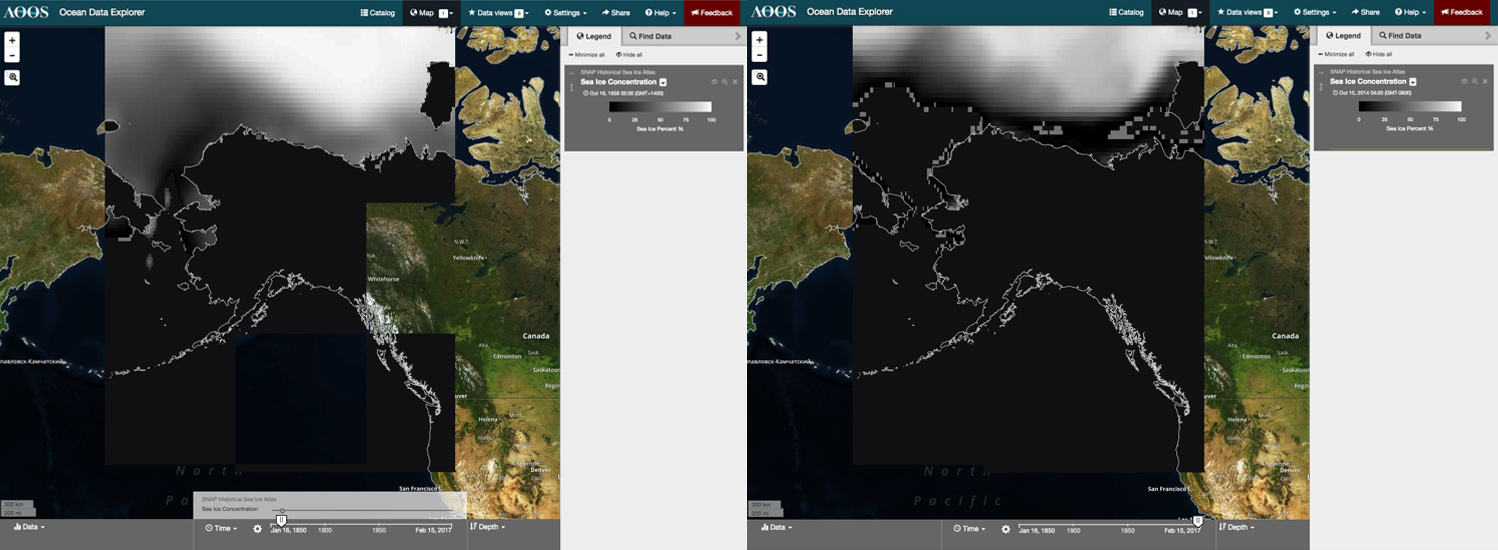
The synthesized sea ice data for Alaska waters are made available through a user-friendly visualization tool available on two websites. Using the SNAP website tool (Figure 1) or the AOOS website Ocean Data Explorer (Figure 2) allows forvisualization of these data projected onto a map, with simultaneous views of sea ice concentration and extent. Despite not being designed for forecasting or prediction, the Atlas does provide useful historical context for future planning effortsand model comparisons.
Project Highlights
This work was completed in collaboration with:
- Recent (1979-2007) period sea ice information has revealed the retreat of summer sea ice in Alaska waters.
- The Historical Sea Ice Atlas indicates that no month since 1850 has had as little sea ice as did the Septembers of the past decade.
- The open water season has increased by 1 to 2 months since 1950 in most coastal areas of Alaska; the increase is even longer at some locations in the Chukchi and Beaufort Seas.
- Data from the Atlas were used in graphic highlighting recent sea ice trends in Alaska for a special report, “State of Alaska’s Environment” (R. Thoman and J. Walsh), Alaska Canter for Climate Assessment and Policy (2019), available at https://uaf-iarc.org/2019/08/23/alaskas-changing-environment/.
- The dataset has been used extensively in a study of the vulnerability of Alaskan coastal communities to storms during open water conditions (R. Rolph, University of Alaska – Ph.D. student who presented findings at the 2017 AAAS Conference), as well as by other scientists working on adaptation planning.
- The feasibility of incorporating additional datasets into the existing tool, outside of the current year NSIDC data, is being considered, including ice observations from Royal Dutch Shell.
Funding Sources & Partners
> Alaska Center for Climate Assessment & Policy (ACCAP)
> Scenarios Network for Alaska & Arctic Planning (SNAP)
> University of Illinois at Urbana-Champaign
> International Arctic Research Center (IARC) at UAF
> NOAA National Weather Service, Anchorage Office
> National Snow and Ice Data Center
> NOAA’s Pacific Environmental Marine Laboratory
> University of Colorado
Partners
University of Alaska Fairbanks: John Walsh (Project Investigator), Sarah Trainor, Lena Krutikov (Project Manager), Corey Hanford (student assistant – digitized charts using polygon method to capture boundaries of each ice concentration category), Michael Lindgren and Bruce Crevenston (programmers of user interface)
University of Colorado: Florence Fetterer (liaison to data sources at NSIDC (National Snow and Ice Data Center)); Vivian Underhill (processor of Danish charts; digitization done using ArcGIS software).
University of Illinois: William Chapman (Data management and liaison to previously digitized datasets; performed spatial and temporal interpolations of data from each source, coordinated dataset fusion, and developed analog fill-in procedure).
Publications and Professional Presentations
Thoman, R.L., U.S. Bhatt, P.A. Bieniek, B.R. Brettschneider, M. Brubaker, S.L. Danielson, Z. Labe, R. Lader, W.N. Meier, G. Sheffield and J.E. Walsh, 2020: The Record Low Bering Sea Ice Extent in 2018: Content, Impacts and an Assessment of the Role of Anthropogenic Climate Change, Bull. Amer. Meteor. Soc., 101(1), 53-58, available at https://journals.ametsoc.org/doi/pdf/10.1175/BAMS-D-19-0175.1
Walsh, J.E., F. Fetterer, J.S. Stewart and W.L. Chapman, 2017: A database for depicting Arctic sea ice variations back to 1850. Geographical Review, 107(1), 89-107.
Walsh, J. E., and W. L. Chapman, 2015: Variability of sea ice over decadal and longer timescales. Climate Change: Multidecadal and Beyond. National Taiwan University, Taipei 203-217.
Rogers, T. S., J. E. Walsh, T. S. Rupp. L. W. Brigham and M. Sfraga, 2013: Future Arctic marine access: Analysis and evaluation of observations, models, and projections of sea ice. The Cryosphere, 7, 321-332.
Walsh, J. E., 2013: Melting ice: What is happening to Arctic sea ice and what does it mean for us? Oceanography, 26, 171-181.
Principal Investigators

Alaska Center for Climate Assessment and Policy

University of Alaska Fairbanks

