AK Marine Highway System CO2 Monitoring
Location of the Data
The Need
The ocean absorbs about 25% of the increasing carbon dioxide released into the atmosphere by humans, now roughly 7 million tons of CO2 every day. As a consequence, seawater is becoming more acidic. Alaska is expected to experience the effects of ocean acidification faster and more seriously than lower latitudes because waters in Alaska are both ‘cold and old’: cooler water temperatures and global circulation patterns mean that Alaska waters naturally hold more CO2 year round. On top of this high baseline concentration of CO2, other processes also naturally lower the pH of Alaska waters on a seasonal scale. Because species can be sensitive to a change in pH, ocean acidification could impact commercial, sport, and subsistence fisheries and wildlife management.
Southeast Alaska has been identified as a particular hot spot for ocean acidification manifestations, and there is a need for repeatable measurements over space and time to understand the current conditions, natural variability, and the long-term trend. Southeast Alaska is home to the majority of the state’s shellfish farms – species particularly vulnerable to ocean acidification – as well as communities highly dependent on subsistence resources and commercial fishing. It is expected that the data produced by this project will be used by multiple agencies, other researchers and projects, and will serve as the lead example for instrumenting additional ferries or ships of opportunity.
Project Location
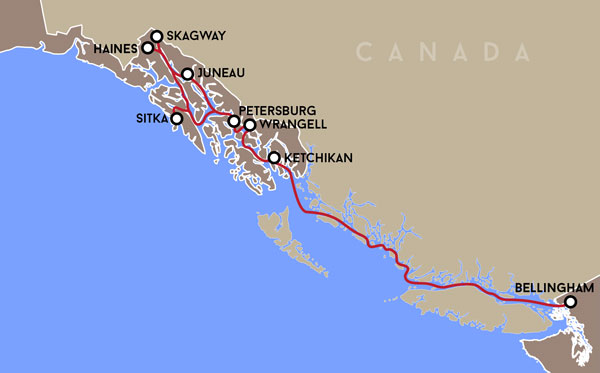
AOOS currently supports over 40 Marine Exchange weather stations in Alaska. Recent efforts are aimed at increasing real time observing Southeast Alaska and British Columbia Coast (Bellingham, WA to Skagway, AK)
Project Details
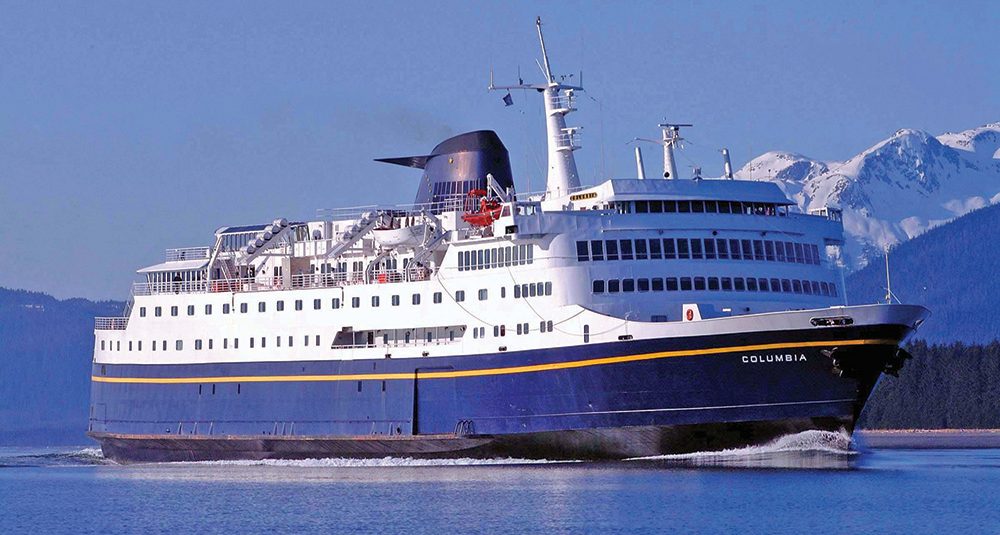
This project uses the Alaska Marine Highway Service ferry M/V Columbia to track carbon system conditions and variability along the Southeast Alaska and British Columbia coasts. The Columbia operates weekly from Bellingham, WA to Skagway, AK* – a round trip of 1,854 miles – and represents the most spatially expansive ferry-based OA installation in North America.
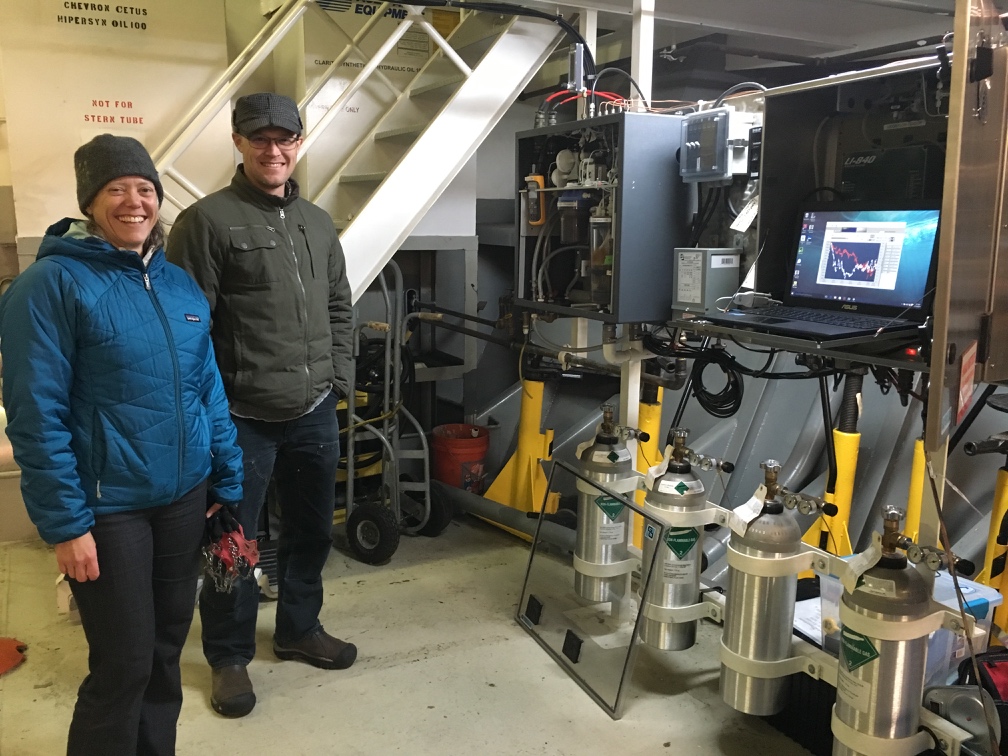
Onboard, the temperature, salinity, pCO2 (partial pressure of carbon dioxide) and dissolved oxygen of the seawater are measured every 3 minutes using a General Oceanics 8050 pCO2 Measuring System. In addition to the surface seawater data, atmospheric pCO2 is measured from an air intake on the foredeck. The combination of these core measurements, combined with an alkalinity – salinity relationship built from data collected largely using AOOS funding on previous work, will allow tracking of the surface water saturation states of aragonite and calcite, as well as pH and the other CO2 system parameters along the ferry’s transit path.
The project’s mission is to understand present-day conditions with respect to ocean acidification, how levels change seasonally, and where there are hot spots or refugia from corrosive waters. This basic information is important for management of marine resources, and when collected over a long enough time, allows scientists to estimate the rate at which ocean acidification is occurring in near-shore Alaskan waters.
*Note: due to Covid-19, the 2020 ferry schedule is very uncertain. Please look here for more information.
Project Highlights
More than 700,000 measurements were collected during 135 transits along the between 2017-2019. The data collected so far point to a dramatically variable seascape that until now had only been documented by the infrequent passes of research vessels and instruments in fixed locations (a mooring and shore-side facilities). Shown here is the saturation state of aragonite, an important mineral that is a type of calcium carbonate used by certain species of shellfish and plankton to make shells. The saturation state is a ratio, and when values are above 1, conditions favor the production of shell material. When values are below 1, conditions favor dissolution and seawater corrodes this mineral.
As can be seen in the data, the surface water is primarily corrosive in fall and winter, representing the most vulnerable time of year for species sensitive to ocean acidification. Then with the onset of spring, two primary factors create a change: the spring phytoplankton bloom removes CO2 from the water through photosynthesis, and the water gets warmer, making aragonite less soluble. The impact of these changes are visible in the graph.
As more data are collected, researchers will begin to tease out natural variability and pair the results with long term monitoring stations in the region to develop estimates on the rate of change.
Resources
- Alaska State Ferry Now Tracking Ocean Acidification
- First data revealed from state ferry Columbia tests on ocean acidity from Southeast AK to WA (radio story)
- Ferry to host long distance ocean acidification study (radio story)
Principal Investigators

Hakai Institute

NOAA

University of Washington

Alaska Coastal Rainforest Center – UAS