Yukon River Chinook are predicted to arrive on the delta slightly earlier than average in 2022: The first significant pulse (15% point) is expected by June 10th and 50% of the run is expected to have arrived by June 18th.
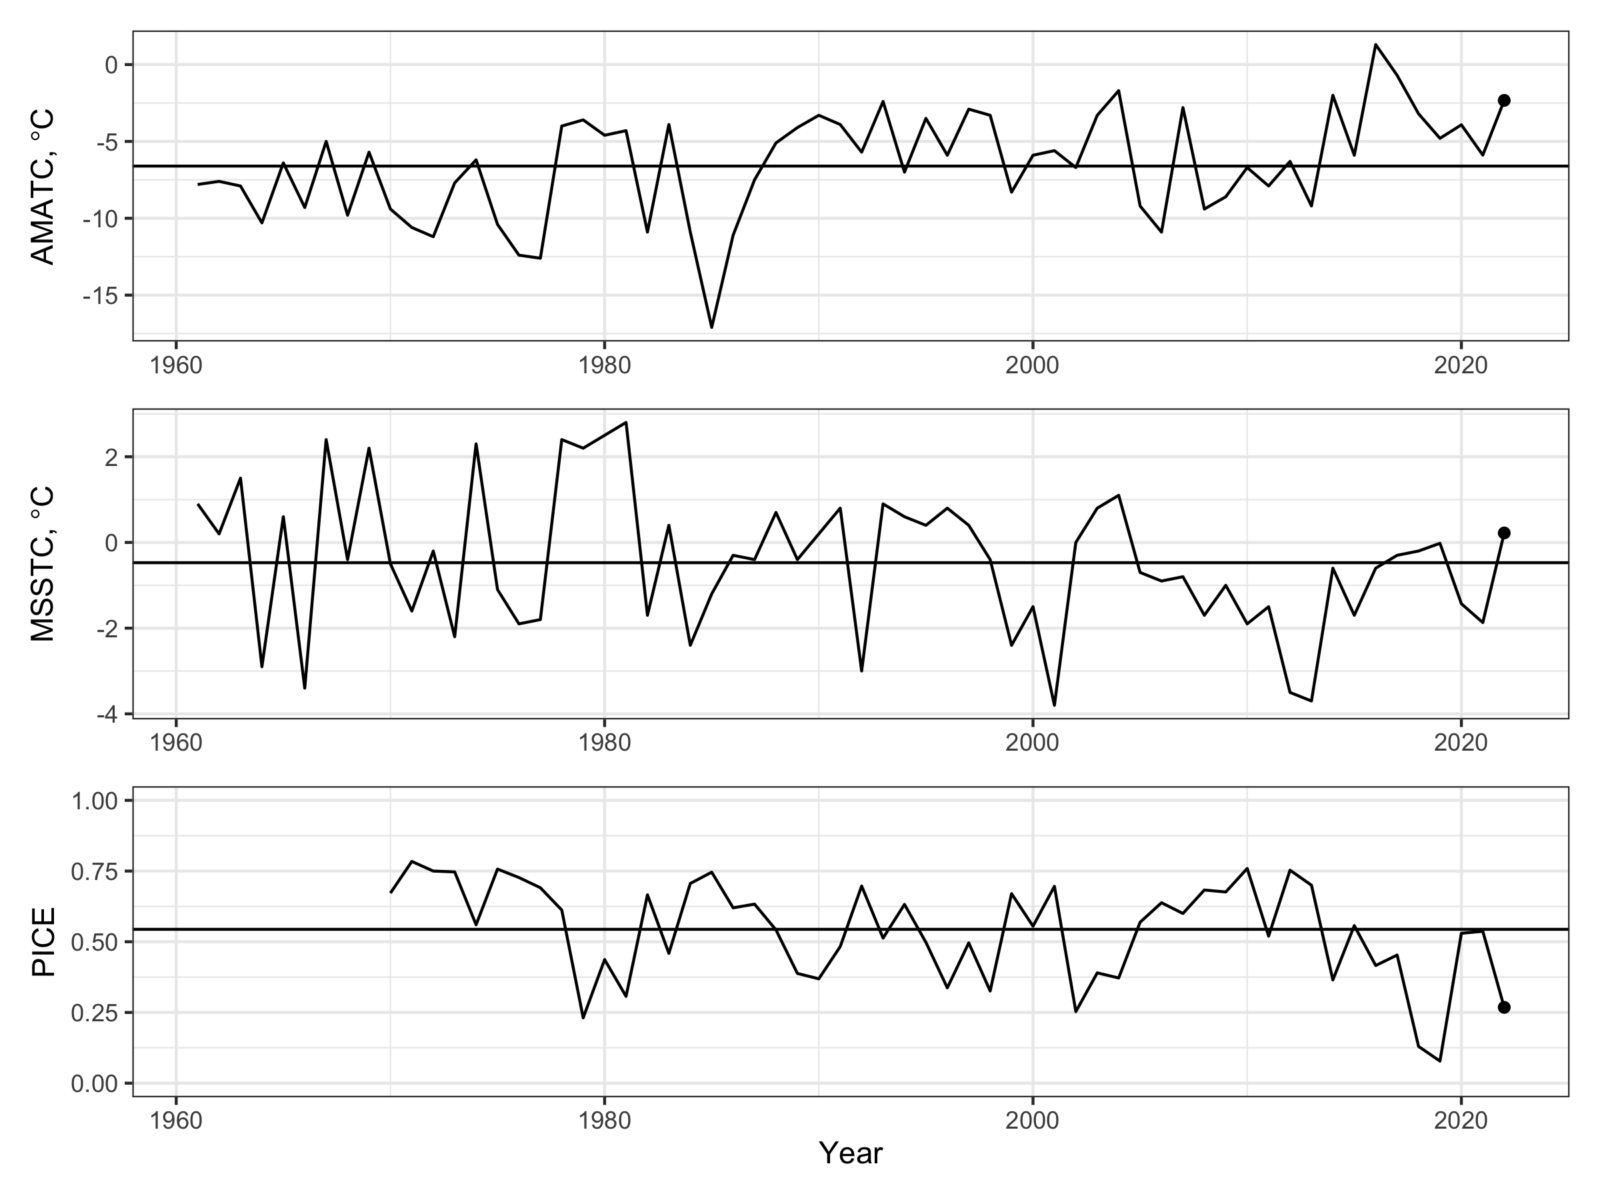
All three established [1] environmental indicators trended warm in the Spring of 2022. April mean air temperature at the Nome, AK airport (AMATC) was -2.3°C, considerably warmer than the long-term average of -6.6°C (range -17.1°C to 1.3°C) and one of the warmest values in the time series. May mean sea surface temperature (MSSTC) measured along the migratory route between the delta and St. Lawrence Island was 0.22°C, which was slightly warmer than the long-term average of -0.47°C (range -3.8°C to 2.8°C). In contrast to 2020-2021, spring-time ice cover between the delta and St. Lawrence Island was 27%, making it one of the lowest values in the time series and considerably lower than the long-term average of 54% (range 8% to 78%) (Figure 1).
Forecast Detail
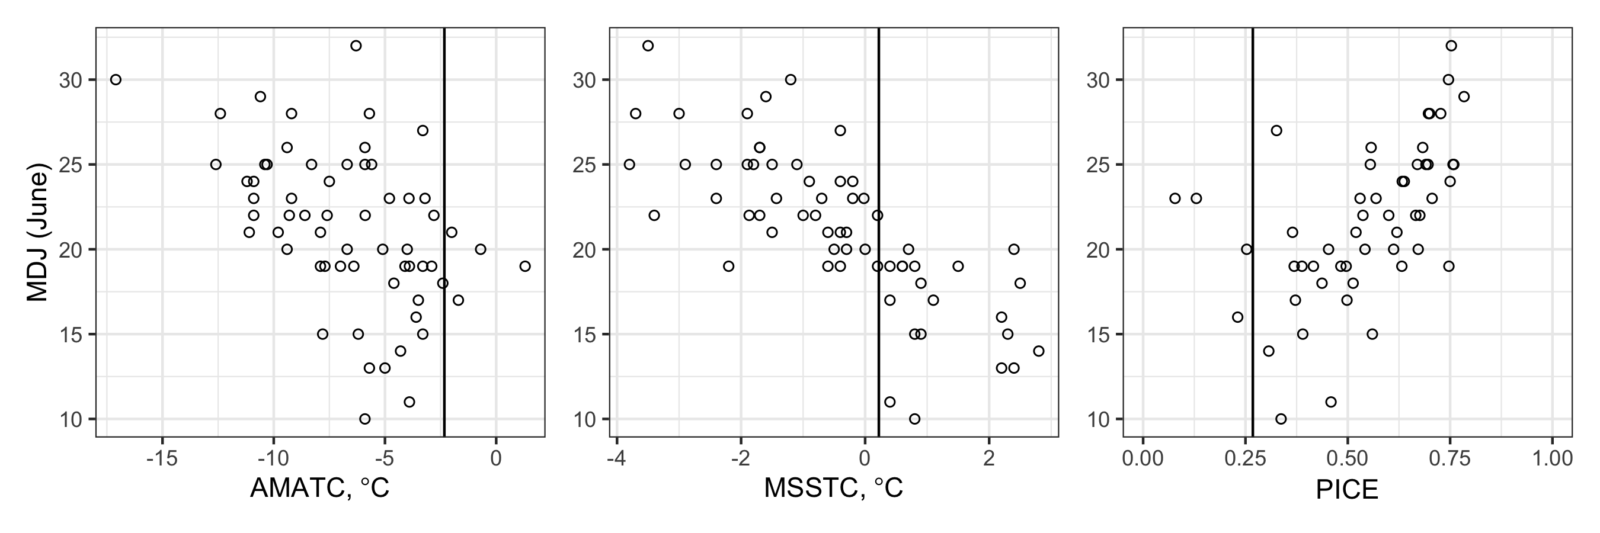
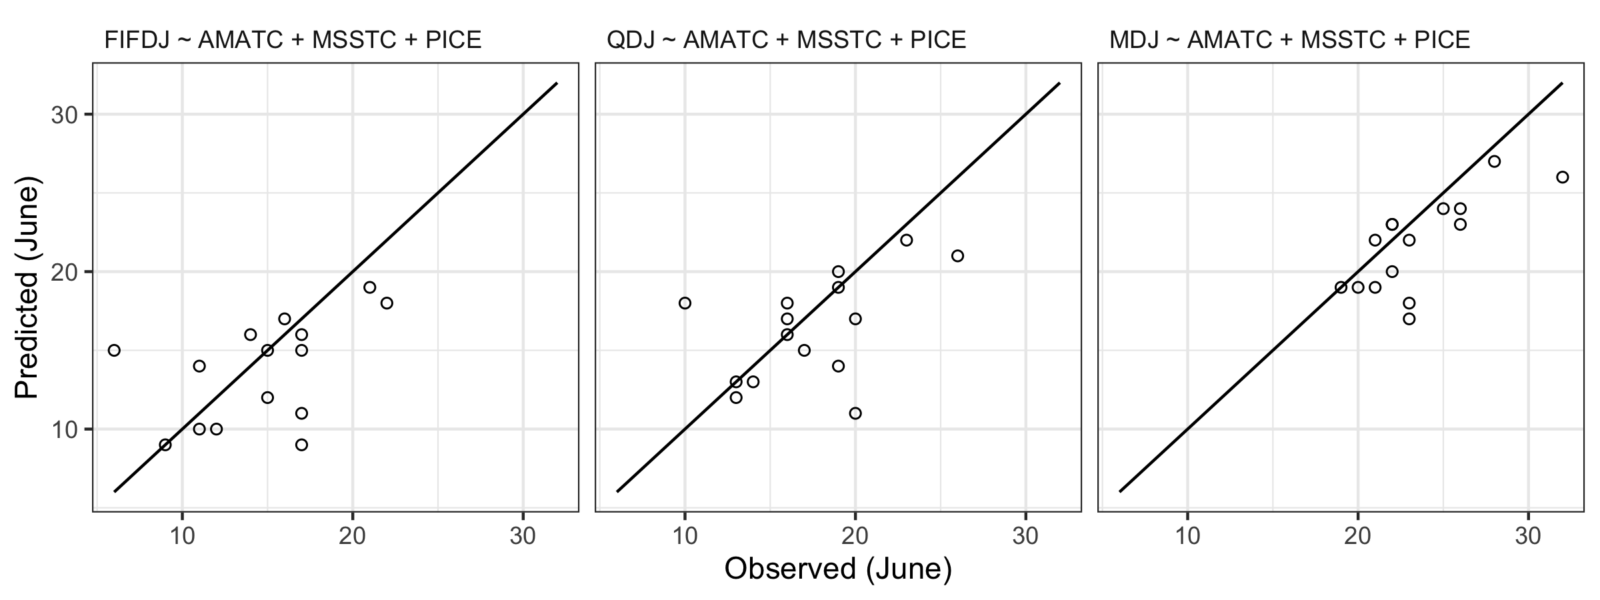
The forecast model is based on the relationship previously established in Mundy & Evenson (2011) [2] which identified a set of three environmental variables which correlate with the run timing of Yukon River Chinook: April mean air temperature at the Nome, AK airport (1961–2021; AMATC), May mean sea surface temperature (1961–2021; MSSTC) in the nominal marine staging area just off the Yukon River Delta, and the Spring-time proportion of ice cover (1970–2021; PICE), also measured over the nominal marine staging area. The forecast model is made of three independent sub-models, where each sub-model is a multiple linear regression with a response of either the 15th (FIFDJ), 25th (QDJ), or 50th (MDJ) percentile of cumulative catch-per-unit effort (CPUE) in either commercial or test fisheries located on the delta (1961–2021).
Based upon the historical relationship with CPUE in commercial and test fishery catches on the Yukon River Delta (1961–2021) and the previously mentioned environmental indicators (AMATC, MSSTC, PICE) [2], the predicted dates of three percentiles of CPUE in the Lower Yukon Test Fishery are June 10th (15%), June 13th (25%), and June 18th (50%) (Table 1).
| Model | Percentile of Cumulative CPUE | Forecasted Date |
| FIFDJ ~ AMATC + MSSTC + PICE | 15% | June 10th |
| QDJ ~ AMATC + MSSTC + PICE | 25% | June 13th |
| MDJ ~ AMATC + MSSTC + PICE | 50% | June 18th |
While only three days earlier than the long-term average for the 50% point of June 21st, this year’s forecast calls for the earliest run timing since 2004 (MDJ=18), though the 2016 run was just a day later with a 50% point of June 19th.
Forecast Performance
We quantified the accuracy of the forecast sub-models using hindcasting with the most recent fifteen years of runs and calculated a set of prediction-oriented evaluation criteria for each (Table 2). All three sub-models (FIFDJ, QDJ, MDJ) perform similarly, with mean absolute prediction errors (MAPE) 2.20–2.93 days. We also calculated prediction intervals by multiplying each model’s standard error by 2σ to get interval widths ranging from 7.71–8.24 days, which contained the observed value 73–87% of the time. Last, we calculated the maximum absolute residual of 6–9 days and prediction bias of -0.93 to -1.80 days which means the forecast tends to be slightly earlier than observed run timing. The forecast’s bias is an area for future forecast improvements.
| Model | MAPE (SD) (days) | Bias (days) | Max. Residual (days) |
| FIFDJ ~ AMATC + MSSTC + PICE | 2.93 (2.74) | -0.93 | 9 |
| QDJ ~ AMATC + MSSTC + PICE | 2.60 (2.87) | -1.00 | 9 |
| MDJ ~ AMATC + MSSTC + PICE | 2.20 (1.93) | -1.80 | 6 |
See the project website as the season progresses for up to date information about how catches at LYTF match the forecast and historical comparisons of catch data. For more information about how the forecast was produced, see https://github.com/yukon-forecasting/2022-forecast. For more information on the forecast model and its underlying biological hypothesis, see Mundy & Evenson (2011) [1].
Acknowledgements
Prepared by Bryce Mecum (brycemecum@gmail.com). Data management and web page support by Holly Kent (kent@aoos.org) and Will Koeppen (will@axiomalaska.com). Yukon Chinook in-season salmon data and management agency coordination by Fred West (fred.west@alaska.gov). Financial and material support provided by the Alaska Ocean Observing System, NOAA National Marine Fisheries Service, and the Alaska Department of Fish & Game.
References
[1] Phillip R. Mundy, Danielle F. Evenson, Environmental controls of phenology of high-latitude Chinook salmon populations of the Yukon River, North America, with application to fishery management, ICES Journal of Marine Science, Volume 68, Issue 6, July 2011, Pages 1155–1164, https://doi.org/10.1093/icesjms/fsr080